English Online Help Topic Detail Statistic
6.6.2.5 Detail statistic
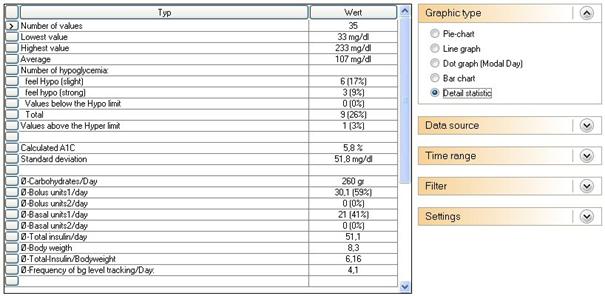
In the detail statistic the selected time range will be analyzed and the
found data will be displayed as a text analysis. The interpretation for the
example above tells you that 35 measurements have been tracked in this time range.
The lowest value was 23 mg/dl. and the highest value was 233 mg/dl. The average
value (sum-up of all single measurements and divided by the number) is 107
mg/dl. Six values were marked with mild hypoglycaemia symptoms (= slight low
blood sugar), 3 serious hypoglycaemia symptoms, but none measurements were
under the hypoglycaemia limit and were not marked with a hypo sign (= unnoticed
hypos. If they appear more than a few times you should talk with your diabetes
team).
The calculated A1C value (see also chapter „Fehler! Verweisquelle konnte nicht
gefunden werden.“)
for this time range is 5,8%, that means if the blood glucose value always
stays within this limit (even in times without measurements), you have to
expect an A1C value in the range of 5,8%.
The standard deviation was 51,8 mg/dl (a good value). That means the blood
glucose value varied about plus/minus 51,8 mg/dl around the average value of 107
mg/dl, which is a stable metabolic adjustment.
Below you can see the average values for certain parameters of this time
range. The value ‘Total insulin/bodyweight’ stands for total insulin per
kilogram of body weight. The value should be under 1,0 for people with
diabetes, who can not produce insulin anymore, otherwise it indicates an
insulin resistance.
The tracked events are counted in the same way and you can see how many of
a special events you have tracked in the chosen time range.